SQL Tab
SQL tab in web UI displays accumulator values per operator.
|
Caution
|
FIXME Intro |
You can access the SQL tab under /SQL URL, e.g. http://localhost:4040/SQL/.
By default, it displays all SQL query executions. However, after a query has been selected, the SQL tab displays the details of the SQL query execution.
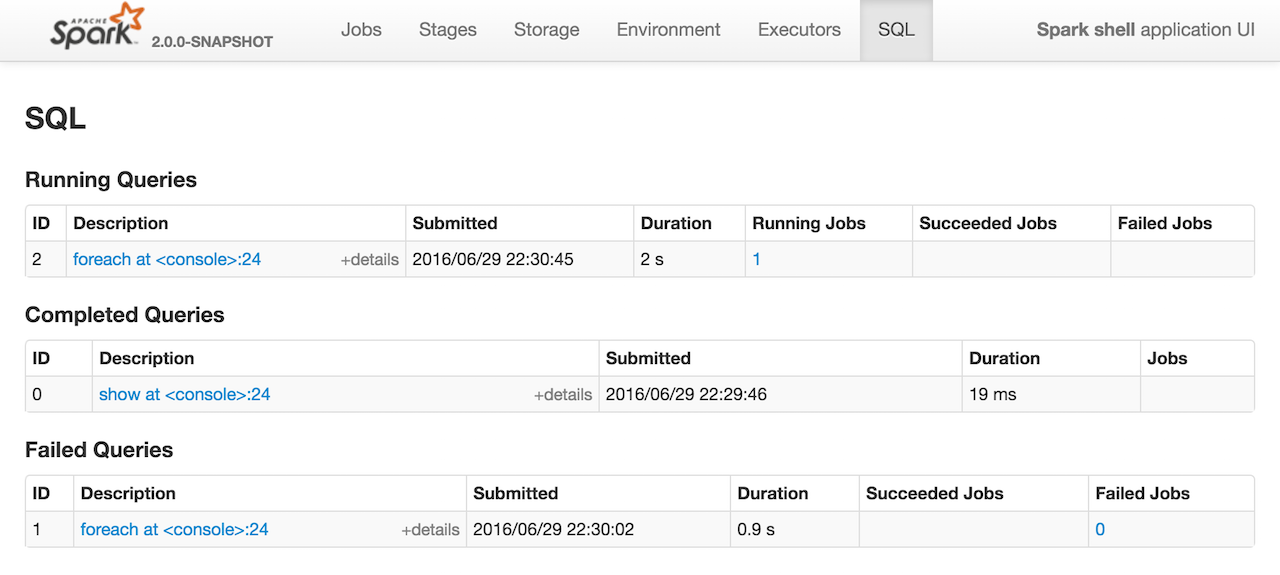
AllExecutionsPage
AllExecutionsPage displays all SQL query executions in a Spark application per state sorted by their submission time reversed.
Figure 1. SQL Tab in web UI (AllExecutionsPage)
Internally, the page requests SQLListener for query executions in running, completed, and failed states (the states correspond to the respective tables on the page).
ExecutionPage
ExecutionPage displays SQL query execution details for a given query execution id.
|
Note
|
The id request parameter is mandatory.
|
ExecutionPage displays a summary with Submitted Time, Duration, the clickable identifiers of the Running Jobs, Succeeded Jobs, and Failed Jobs.
It also display a visualization (using accumulator updates and the SparkPlanGraph for the query) with the expandable Details section (that corresponds to SQLExecutionUIData.physicalPlanDescription).
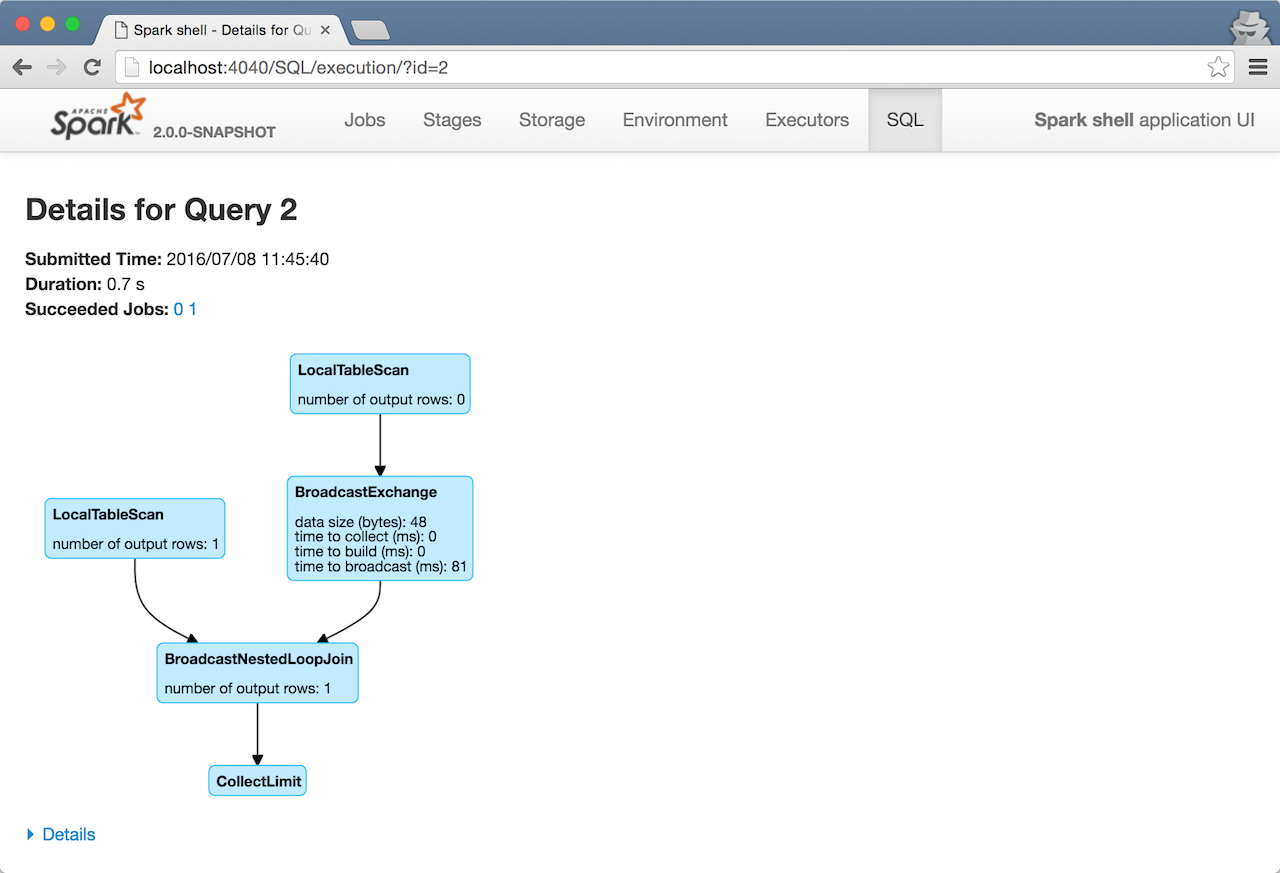
Figure 2. Details for SQL Query in web UI
If there is no information to display for a given query id, you should see the following page.
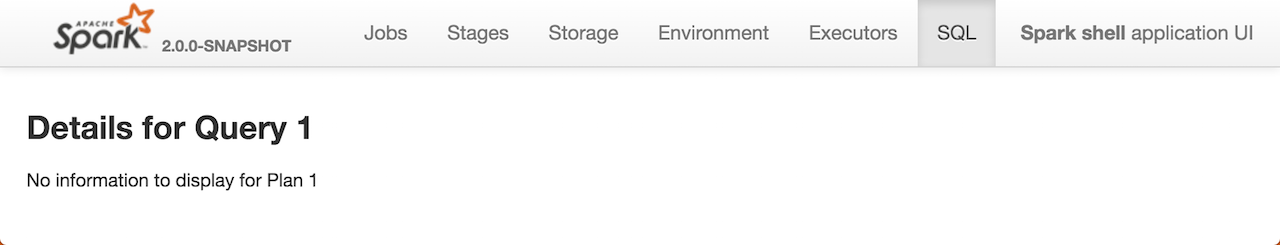
Figure 3. No Details for SQL Query
Internally, it uses SQLListener exclusively to get the SQL query execution metrics. It requests SQLListener for SQL execution data to display for the id request parameter.
Creating SQLTab Instance
SQLTab is created when SharedState is or at the first SparkListenerSQLExecutionStart event when Spark History Server is used.

Figure 4. Creating SQLTab Instance
|
Note
|
SharedState represents the shared state across all active SQL sessions.
|